Tong Lo
← Home
Qualitative data collection tool
2025
-> Build-ready UX design
-> Research tool
-> Build-ready UX design
-> Research tool
A research tool designed to automatically and ambiently collect image data in remote work settings
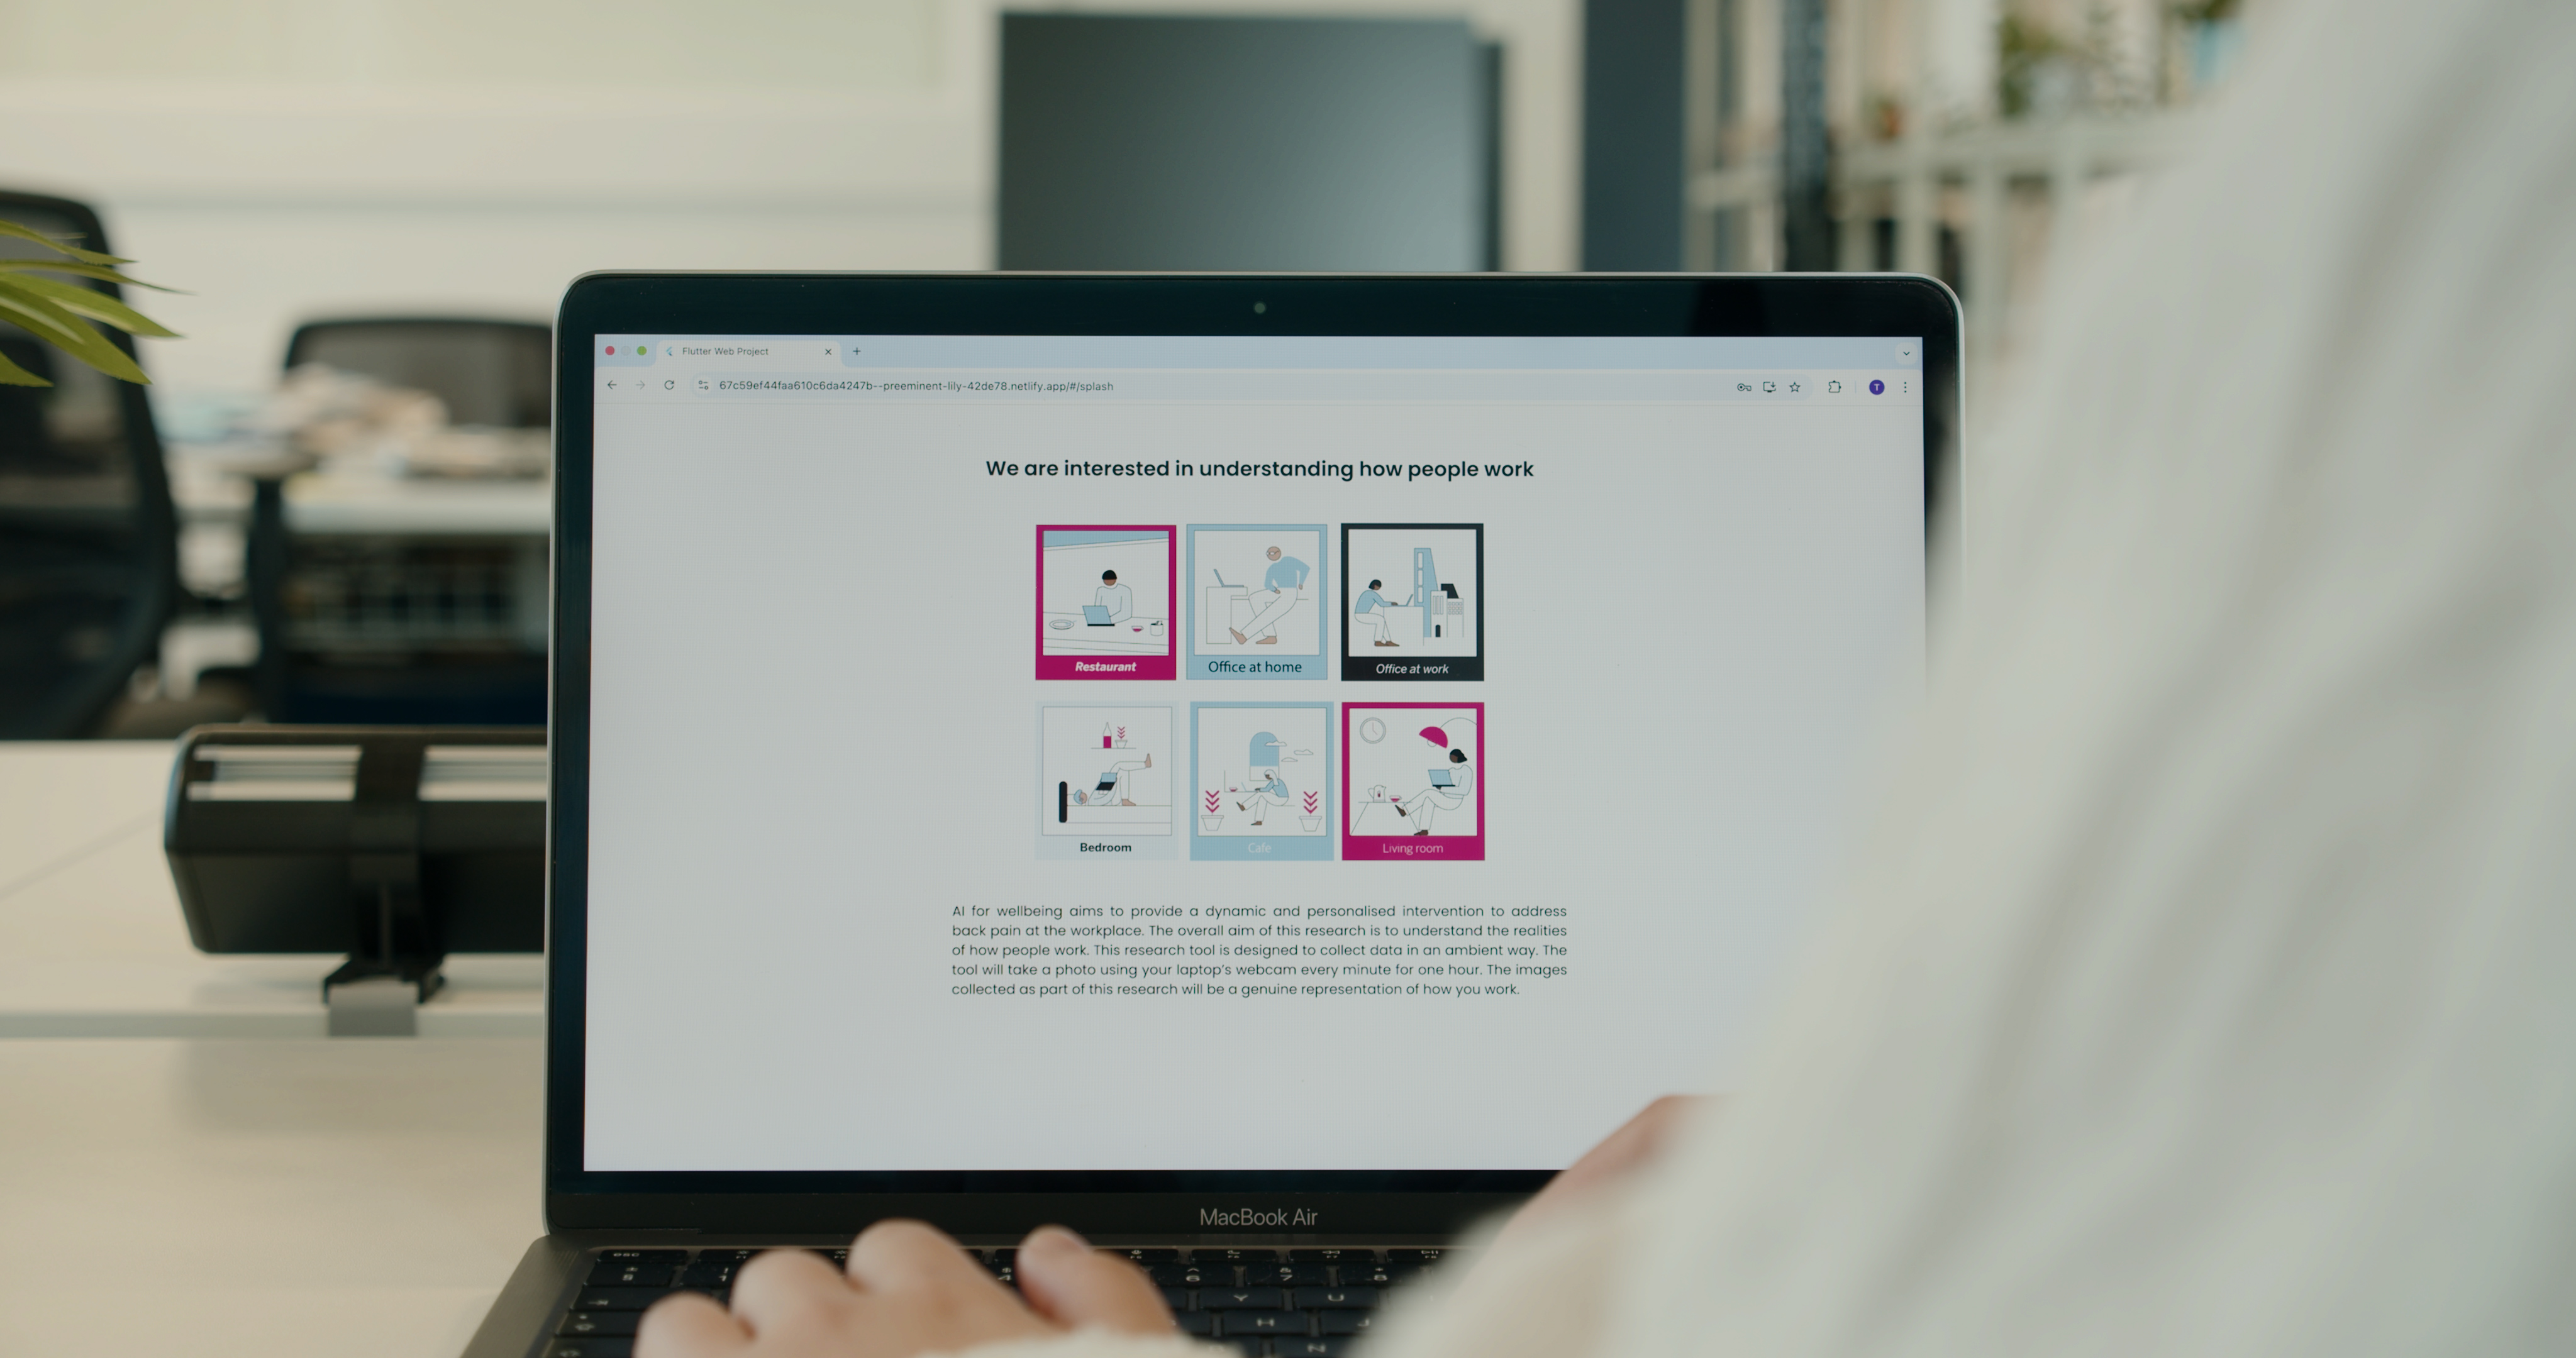
Work now happens in multiple locations, some more suitable than others. Conducting qualitative research on people's work habits across these diverse environments would create a large data repository. This research tool is designed to collect comprehensive data in time-efficient ways that reflect the realities of work.
Overview
Qualitative research is often challenged by its time-consuming and resource-intensive nature. Traditional qualitative methods often struggle to collect large amounts of data efficiently, and with the presence of the researcher in a controlled environment, the data frequently fail to represent real-life conditions accurately.
This research tool aims to create image data ambiently and automatically as people work on their laptops in remote settings. We hope to collect realistic data on people’s work habits to inform the dataset we would collect for a larger intervention that addresses back pain in the workplace. This could help people better understand, and make informed decisions about, factors that affect their back health. See initial research AI X Design Lab.
This research tool aims to create image data ambiently and automatically as people work on their laptops in remote settings. We hope to collect realistic data on people’s work habits to inform the dataset we would collect for a larger intervention that addresses back pain in the workplace. This could help people better understand, and make informed decisions about, factors that affect their back health. See initial research AI X Design Lab.
Process
What did we do?
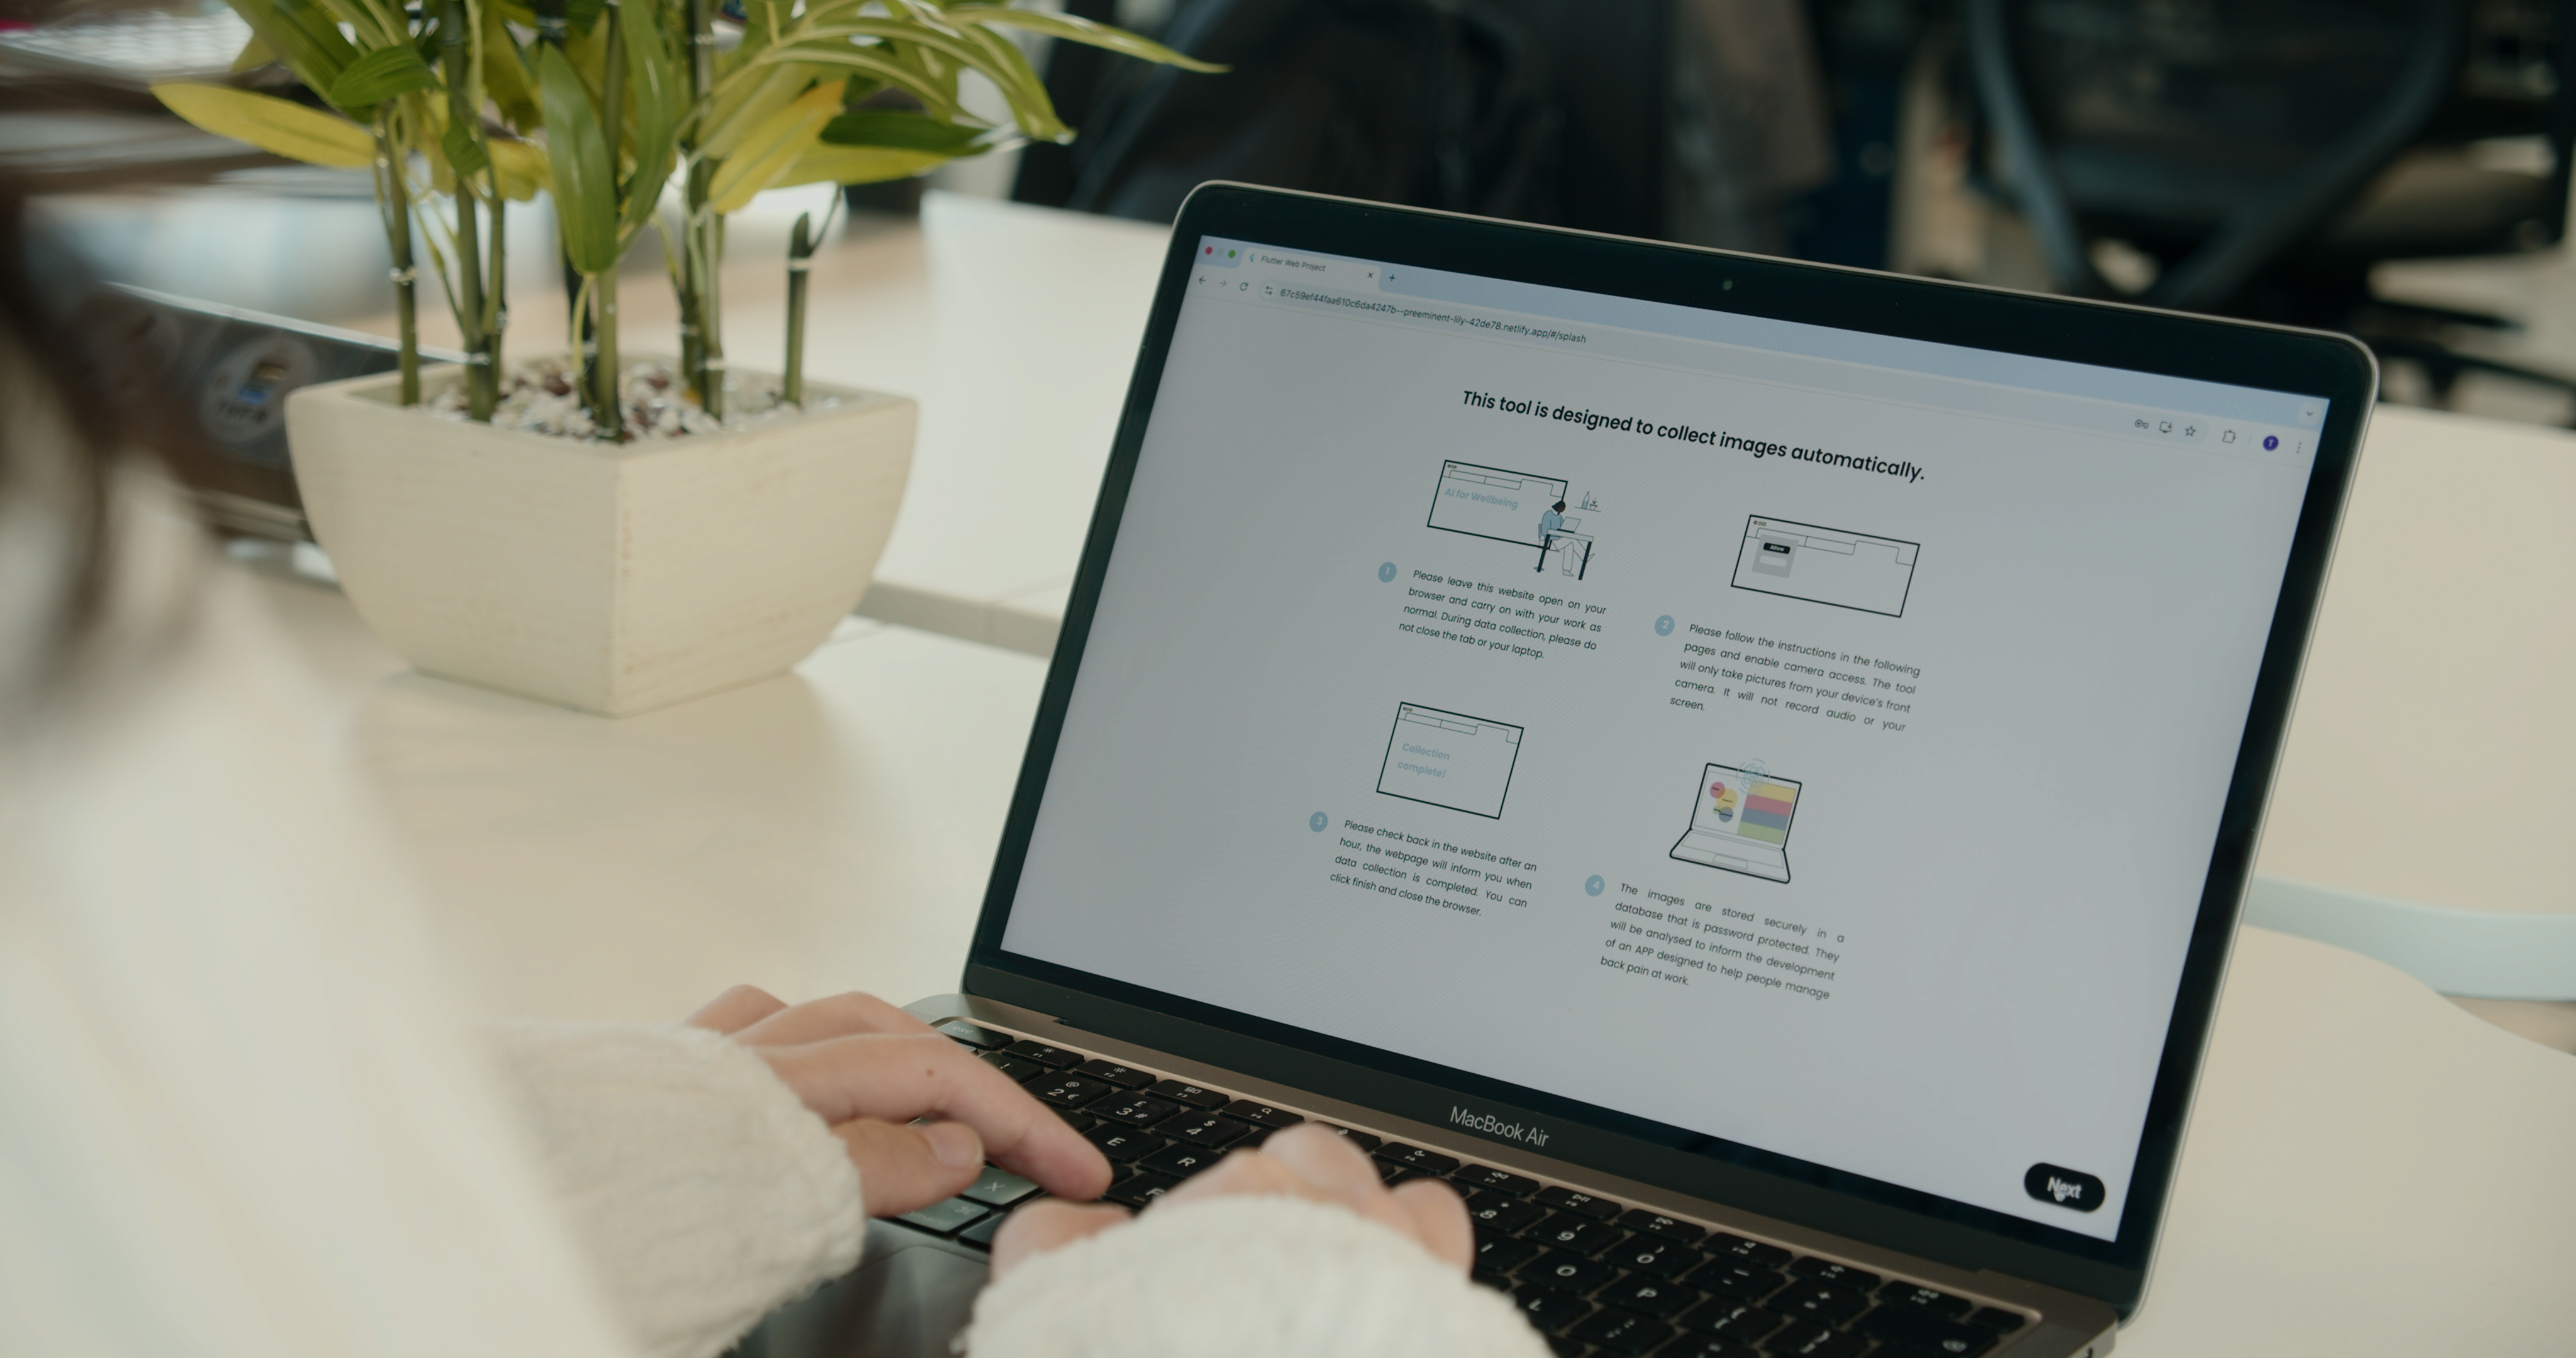
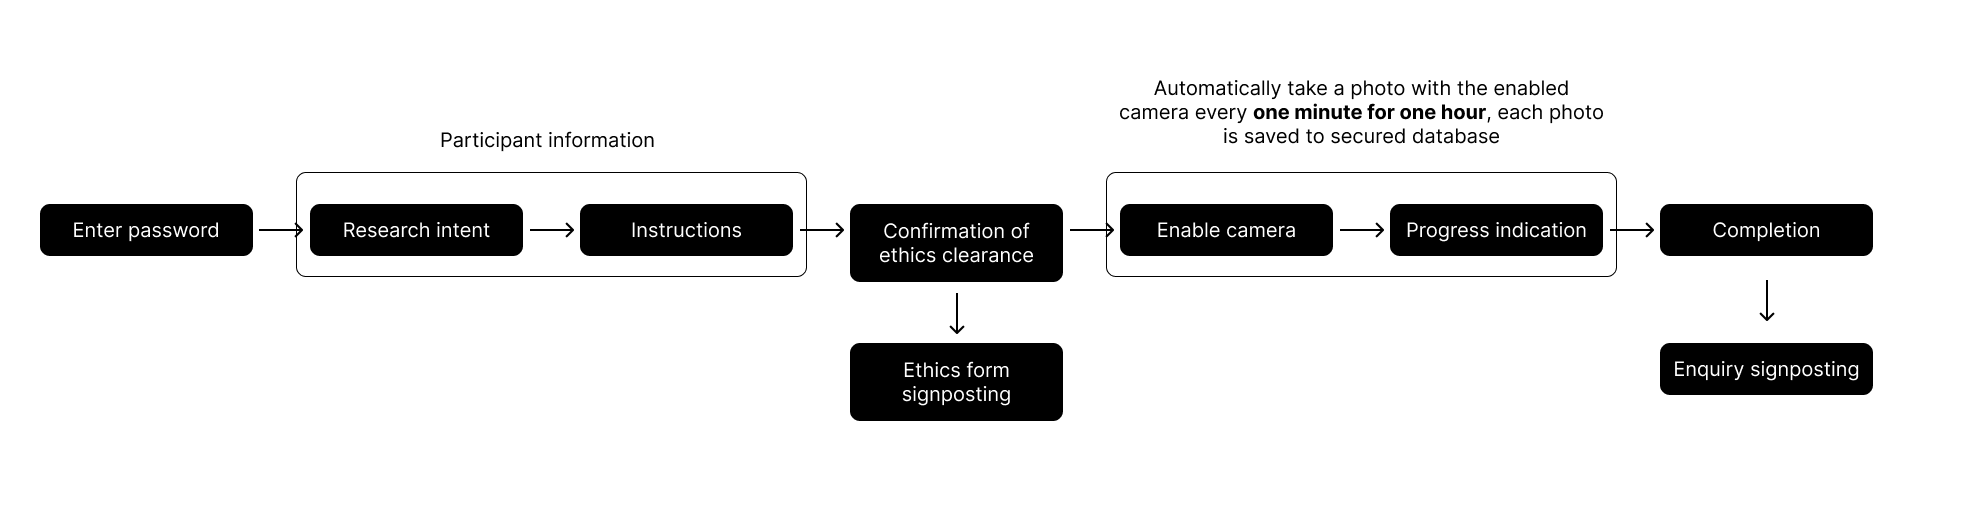
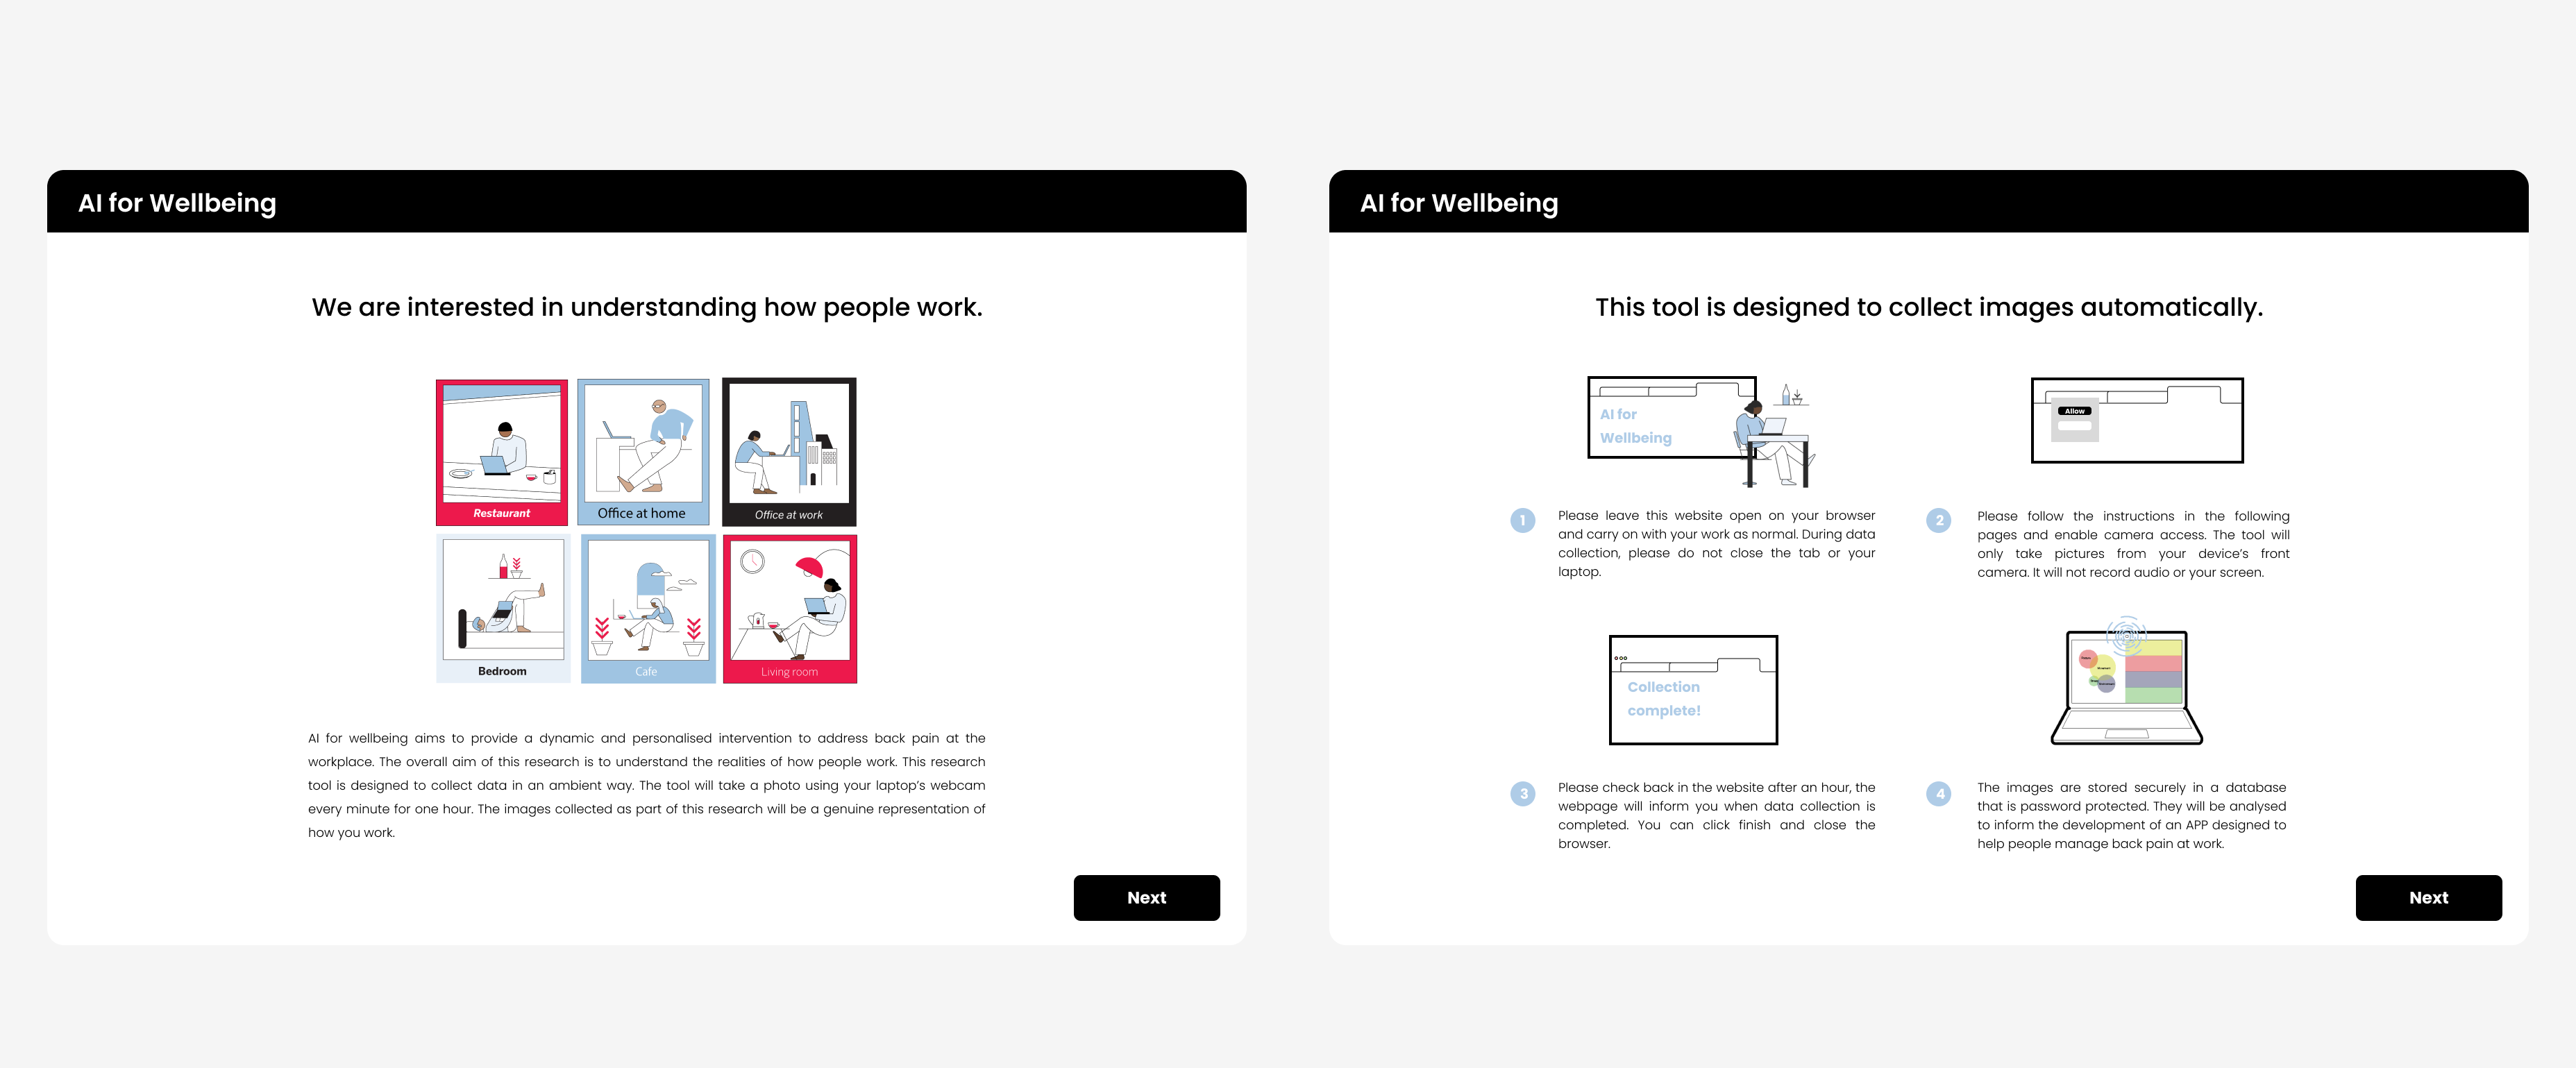
(1) User flow We began by outlining the complete user flow to map how participants would navigate through the data-collection tool from start to finish. Because the data is collected ambiently, the goal was to provide a clear walkthrough that helps participants understand what will happen and what to expect throughout the process.
(2) Figma mock-up
Using the user flow as a guide, we created a detailed Figma mock-up to visualise the interface and layout. The mock-up included screen designs, interaction patterns, and component placements, helping us validate usability before development. This stage allowed us to refine the look and feel and gather early feedback.
(3) Development
After finalising the Figma mock-up, the design package was handed over to the developer for implementation. The developer translated the interface and interaction specifications into a functional web-based tool. Once completed, the tool was deployed as a password-protected link, which we then shared with participants for data collection.
User flow︎︎︎
![]()
![]()
Figma mock-up ︎︎︎
![]()
![]()
![]()

Figma mock-up ︎︎︎

Data Collection
How did it work?
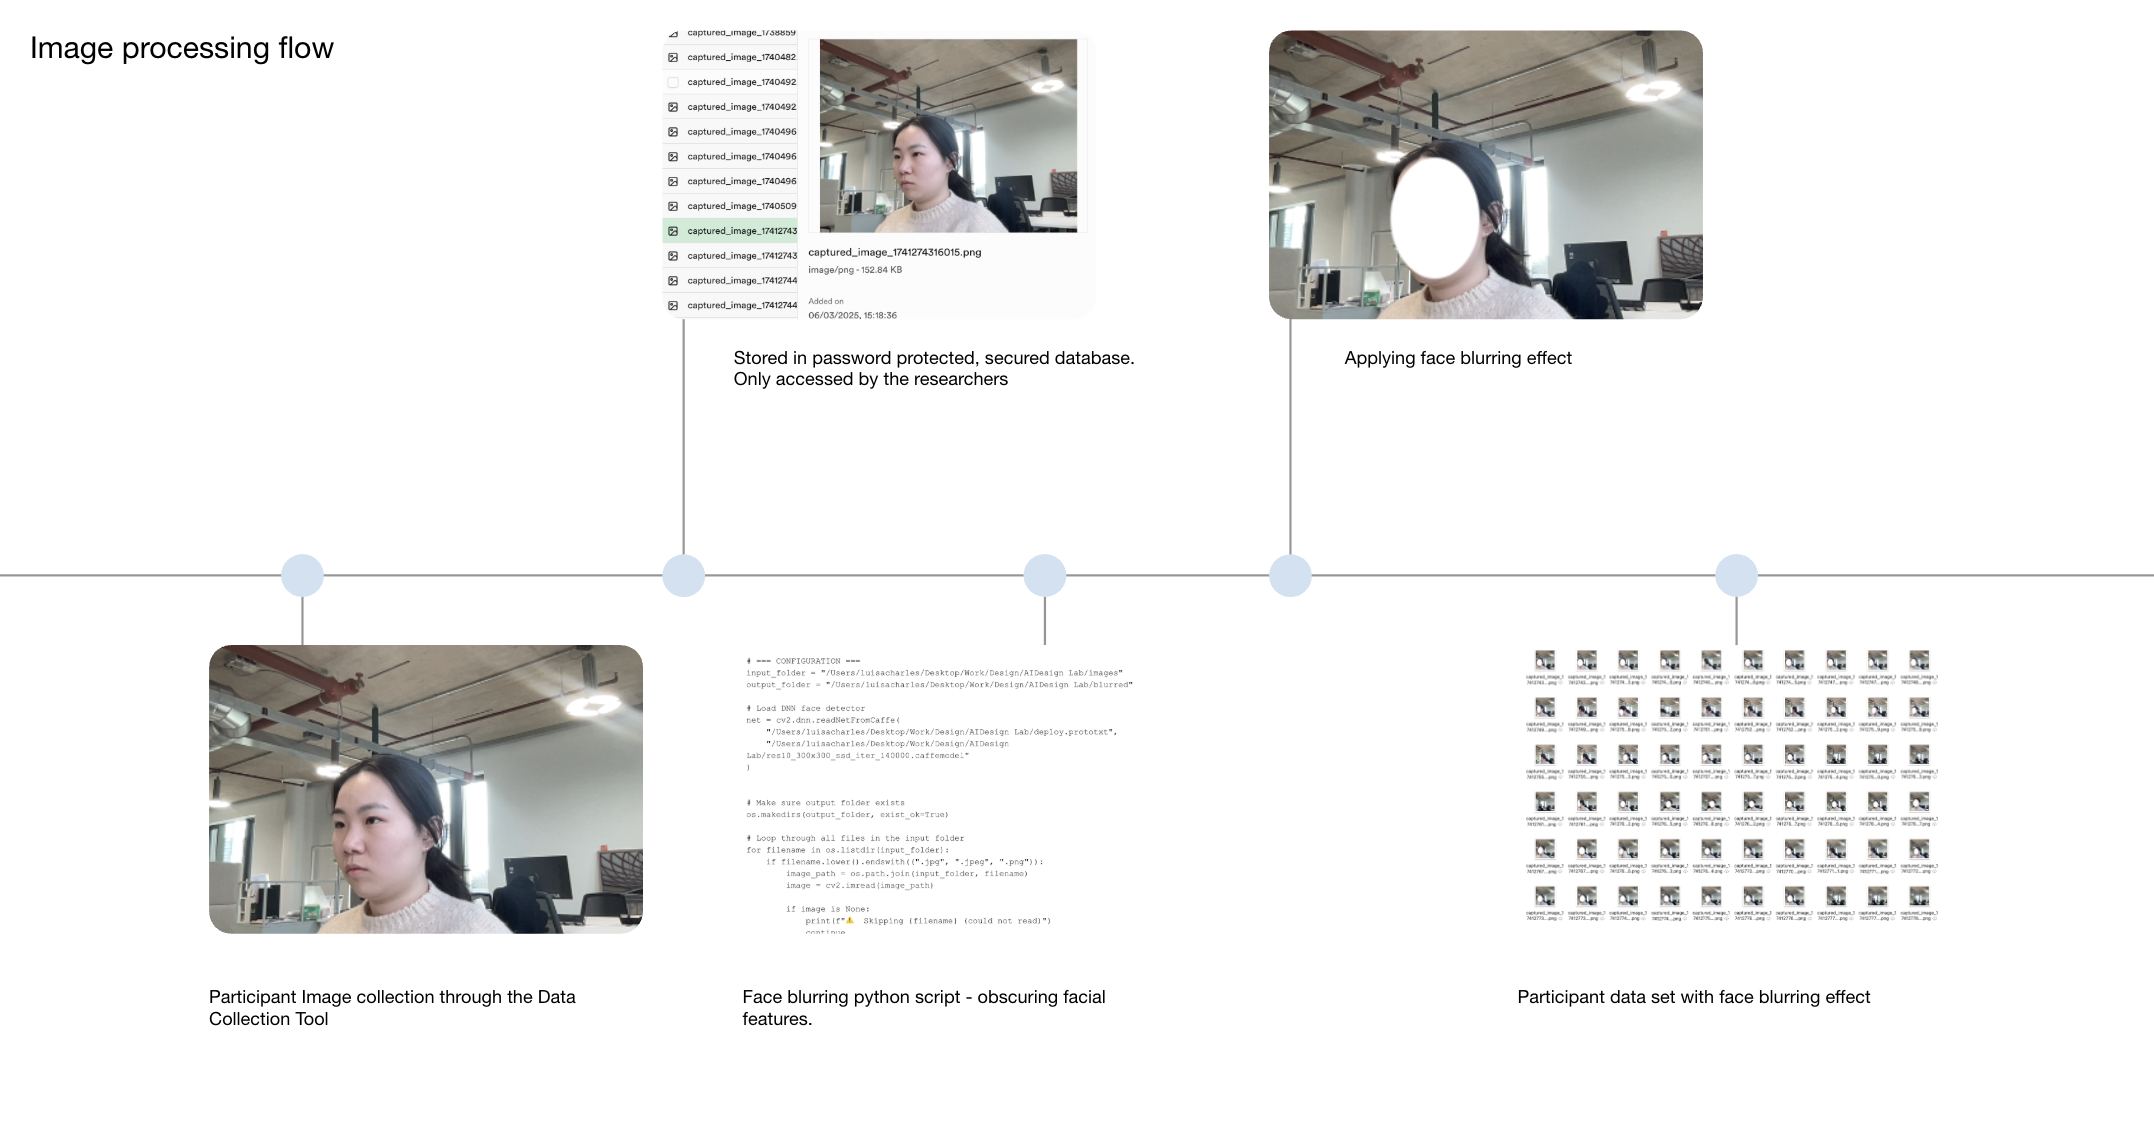
(1) Image processing flowIn one hour, the tool collects 60 images from each participant using their laptop camera. Adhering to the research ethics protocol, the collected images go through a processing flow that obscures the participant’s identity before the researcher’s further analysis.
(2) Translation of research data into actionable insight
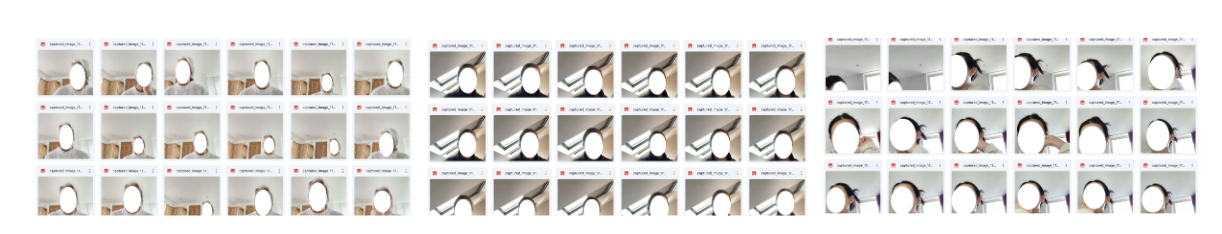
We collected images from 8 participants. The insights from the image data have inspired an APP prototype -> See the app here.
Image processing flow︎︎︎
![]()
Examples of image data︎︎︎
![]()
Examples of image data︎︎︎
Iterations
Where did I start?
(1) The first prototype
Initially, I built a tool to record videos of people at work. It detects the user within the camera frame, applies a segmentation mask over their body, and includes basic data analysis features such as a percentage bar showing how much space the user occupied - used as an indicator of their range of motion.
However, early testing revealed several issues:
-
Installation complications
-
Extremely large video file sizes
- Multipurpose components with an unclear purpose (the percentage bar)
(2) The second prototype
Improved access
Data collection was moved to a web link that participants could access directly, reducing installation barriers and simplifying the workflow. The masking and analysis processes were then streamlined into the Image processing flow, conducted locally.
Reduced computation load
The tool takes images instead of videos to reduce file size while maintaining sufficient information to indicate trends.
Output video from first protoype︎︎︎
![]()
Deployment of second prototype︎︎︎
![]()
![]()
Deployment of second prototype︎︎︎